Trend Report Deep Dive: Taming the Algorithm

The “Algorithm.”

As a colloquial term for the recommendation engines responsible for customizing many of our online search results and social media feeds, the ‘Algorithm’ has, perhaps surprisingly, emerged as one of the more controversial forms of artificial intelligence (A.I) technologies within public discourse.

Developed as a tool to help people find what they’re looking for faster and discover new things matched to their interests, the ‘Algorithm’ has also been criticized for the way it can lead to self-reinforcing consumption habits, particularly within social media, which could partially explain trends for political polarization and extremist ideologies. Despite these misgivings, most people still use (and even enjoy) at least some forms of the ‘Algorithm’ as part of their daily online experiences, and the technology is even becoming more integrated into many physical location-based experiences as well, a trend that is unlikely to reverse.

Thinkwell’s 6th Annual Guest Experience Trend Report was an opportunity to predict and envision new ways we expect to see A.I. technologies (such as recommendation algorithms) become incorporated into theme parks, museums, and resorts. Yet, more importantly, it was also a chance to reflect and listen to what our guests actually want from these technologies and experiences.

As part of the trend report survey of over 1,300 people, participants were given hypothetical concepts of A.I. technologies applied to theme parks, museums, and resorts, and were asked to rate their favorite and least favorite aspects of the experience. Among these concepts were several that incorporated recommendation algorithms as part of the guest experience: 

  • A theme park could eliminate queues with virtual queuing and A.I. recommended scheduling.
  • A museum could create a personalized digital tour based on the visitor’s interests.
  • A resort during a busy holiday could automatically schedule reservations and activities that guests might like when they become available.

Participants rated all these concepts positively overall, each with its own particular reasons for why they liked it. Yet when asked about potential concerns with these concepts, one consistent trend emerged across all the data:

Guests want control over their experiences.

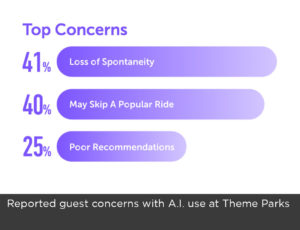
For all of these three concepts, the most disliked aspect was the technology’s proposed ability to structure the guest experience and make plans for them, which was perceived to reduce guests’ sense of personal agency and spontaneity. These concerns were shared by between 41% to 51% of participants in each category.

Interestingly, this concern was separate from the participant’s confidence in a recommendation algorithm’s ability to accurately make good recommendations. For the resort concept, 50% of respondents said they wanted more control over their plans, while only 33% reported that they didn’t trust the algorithm to make good recommendations. This may suggest there’s a subset of people who expect to enjoy what the system recommends but will still dislike the fact that they weren’t given the freedom to choose it for themselves. A further 37% of participants specifically called out the ability to discover new activities as a top reason in favor of the concept.

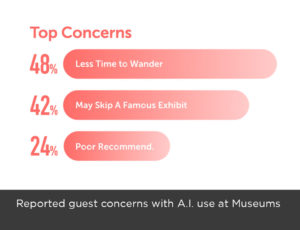
Indeed, when separated from the mandatory planning aspects, participants responded quite positively to the technology’s ability to suggest recommendations based on their interests. While 48% of respondents to the museum concept were concerned about their ability to freely wander (the most common concern), 53% of participants still selected “I’ll see unique exhibits more related to my interests” as a positive reaction. This feature gained the single highest positive response rate out of any of the multiple museum concepts in the survey. While visitor attractions always strive to offer guests as much choice as possible, with increasing demand for quality guest experiences, it has become necessary for capacity management systems such as virtual queues and pre-planned booking to limit guests’ options.

Online tickets for museums often mean committing to a specific date; popular resort activities require advanced reservations; and virtual queues for attractions often assign limited return windows. Recommendation algorithms can help these systems offer guests better choices when faced with limited options, but it can also turn guests against the recommendations entirely if they come to associate it with the technology that is limiting their ability to engage the way they want.

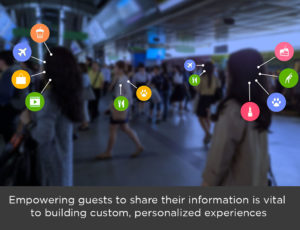
Recommendation technologies applied to location-based experiences should always be used to empower guests. For the near-future, it’s important to give guests a reason to trust the ‘Algorithm’ as a way to discover better experiences that are already available to them. If restrictions are necessary, do so in a transparent way that allows guests to retain as much control over their experience as possible, without asking any more from guests than what is absolutely needed.

Looking further ahead, it’s possible that A.I. technology will become sufficiently advanced so these recommendations and restrictions can become effectively invisible to guests. Imagine, with detailed probabilistic forecasting, an A.I. system could figure out for each guest the most likely paths they’ll take and decisions they’ll make, and hold several ‘phantom’ reservations for their most likely desired options. These invisible digital reservations could be in a state of constant reassignment by the system as demand fluctuates and the algorithm updates its recommended forecast with new real-time data. A ‘phantom’ reservation would only become tangible and activated the moment the guest arrives at the restaurant, attraction, or special exhibit… just as if it had been the guest’s spontaneous choice all along.

Obviously, there are many logistical and technological challenges to overcome in order to make this vision a reality. But the development of A.I. technologies won’t be slowing down. As experience designers, it’s essential to do our own forecasting of future possibilities, and that includes understanding what our guests actually want. It’s clear that artificial intelligence can’t become a substitute for human decision-making. As humans, we all want to be treated with respect for the choices we make by our own free agency. Sometimes, that also means relying on a trusted recommendation.

Trend Report Deep Dive: A Look at The Bias In Artificial Intelligence

The rapid development of Artificial Intelligence (A.I.) has opened a window in time to discuss, debate, and dream of the many ways this technology could impact all aspects of our life. Being on the precipice of an era where machines can emulate human intelligence is also cause for reflection on questions and issues around what it means to be human.

The 6th Annual Thinkwell Trend Report isn’t just about the future possibilities of A.I. technologies within location-based experiences, but also about the realities and challenges that face the people that use A.I. The survey and report were created during a challenging year which laid bare many of the ways in which different human identities can lead to vastly divergent lived experiences. We saw evidence of deep divisions and conflicts along racial, social, socio-economic and gendered lines in recurrent marches and protests, in disturbing revelations of harassment and assault, in the way a worldwide pandemic proved disproportionately deadly based on age, ethnicity, and socio-economic status, and the continuing and widening gap between different economic groups. 

For these reasons we felt it was important that this Guest Experience Trend Report on Artificial Intelligence include questions within its survey of over 1,300 people that could evaluate the ways that race, gender, and age can influence one’s general attitude towards (and direct experiences with) emerging A.I. technologies. The results from this set of survey questions were then summarized in two Data Analysis articles accompanying the main trend report.

  • Bias in A.I. – How have different people experienced bias in A.I. technologies, and how would they suggest addressing the issue?
  • Generation Gaps – To what degree does age determine attitudes towards A.I. technologies?


Among some of the key findings of these reports:

  • Racial identity of respondents contributed up to a 15% difference in reported first-hand experience of bias, as well as general concern about bias in A.I. technologies. 
    • Asians reported both the most concern and direct experience, while white respondents reported the least.
  • Men and women exhibited similar levels of concern about Artificial Intelligence bias. Men were more positive about reporting personal examples of bias they experienced than women, who were more uncertain about their experiences of potential bias.
  • Younger people were both more concerned about the challenges of A.I. (and supportive of regulating this technology), yet were also more optimistic about its future benefits than people from older generations.


The implications of this data should have a profound effect on the process of designing for social experiences that involves A.I. technology. For example, facial recognition technologies have been touted for their ability to provide more personalized, seamless, or interactive guest experiences, yet emerging evidence of their uneven performance across ranges of skin tone and race- or gender-linked facial characteristics may unfairly target or exclude certain guests. Additionally, the very presence of this technology may trigger or enhance existing concerns of guests. The data also suggests that younger audiences in particular may demand more transparency about how A.I. technologies are used as part of the guest experience.

Being anti-bias requires a proactive approach. We at Thinkwell believe that inclusive design must engage every member of the design and development team, and that the team must include people of diverse backgrounds, identities, and viewpoints at all levels of seniority within the company structure. To be proactive in this belief, Thinkwell has established its own Diversity & Inclusion Council. The Council is tasked with continuing to identify not just challenges, but possible solutions, and with the goal of continuing to empower diverse voices within our company and within our industry. A small but important aspect of that empowerment includes collecting the data necessary to better understand and work against racism, sexism, and ageism within the experience design industry, a task that the Trend Report helps to further illuminate.

Thinkwell Group’s 6th Annual Guest Experience Trend Report: Artificial Intelligence

Thinkwell’s 6th Annual Guest Experience Trend Report, released today, explores artificial intelligence (A.I.) and its applications in experiences, breaking down key takeaways and predictions for how A.I. can affect, adapt, and improve the guest experience in museums, theme parks, and beyond. With the prevalence of virtual assistants, smart home devices, and smart digital features in everyday life, the A.I. revolution is already here for consumers. At the same time, A.I. is also becoming more involved in our experiences, and there’s no shortage of ideas for what A.I. can achieve and contribute to the guest experience. 

With input from a representative sample of more than 1,300 survey respondents, Thinkwell’s 6th Annual Guest Experience Trend Report breaks down three ideas around the guest experience and integration with A.I., while also exploring the rising demand for technology and personalization. 

Three Big Ideas for A.I.:

  • Physical queues are waiting for obsolescence. What does this mean for the entire experience?
  • Guests want to make discoveries. A smart guide can help.
  • A.I. is about getting personal. What happens when you’re able to combine human and artificial intelligence for personalized interactions and service? 

“The potential to use A.I. for guest, brand, and operator benefit is limitless,” says Craig Hanna, Thinkwell’s Chief Creative Officer. “Thinkwell is focused on providing innovative, practical, and inclusive solutions to enhance the guest experience in any setting, and A.I. can play a big role in guest experiences and technology decisions as we look to the future.”

For Thinkwell’s insights, data highlights, and predictions on the future of artificial intelligence and guest experience, read the full report here.

White Paper | The (Sometimes Dumb) Wisdom of Crowds: Experience Design and Augmented Reality in a Post-Pokémon Go World

Augmented Reality. It’s a phrase that’s been bandied about for over a decade. It’s a concept that’s come to life in myriad ways. But until the launch of Pokémon Go, the promise and pitfalls of AR hadn’t been laid bare on a grand scale. Now, as Pokémon Go ignites countless Facebook wars, propels Nintendo’s market value by upwards of $7.5B USD, and sees parks and public spaces overrun with children and adults—individually and in groups—running around gathering Pokémon and snagging treats at Pokéstops, we’re seeing the potential for fun, community building, and social engagement on a grand scale. But we’re also witnessing the problems inherent in building a massive AR based upon decisions made long ago, rooted in data collected in part from users, and disconnected from the realities of a changing world.

As a quick overview, Pokémon Go is an augmented reality game1 played via a smartphone or cell-enabled tablet. Players traverse the real world, catching Pokémon, visiting Pokéstops to gather supplies, and battling at Pokégyms. Pokéstops and Pokégyms are “anchored” on the map to actual places, such as statues, fountains, signs, gardens, or specific locations in or near buildings such as churches. Niantic, the company behind Pokémon Go, spun off from Google with investment from Nintendo, the Pokémon Company, and Google, after their successful launch of an earlier AR game called Ingress—and that’s where a number of the issues lie.

The Pokémon Go map is built in large part upon the Ingress map2. Ingress, while it has millions of app downloads (upwards of seven million), has a relatively small core player base (current estimates range from 350,000-750,000 active, regular users). Its rollout was also staggered, launching on the Android platform first, on December 14, 2013, and then for iOS on July 14, 2014. Without delving into the backstory, much of the action in Ingress revolves around portals—interacting with them to gain items, deploying items to claim or improve them for your chosen faction, defending them against the other faction. It’s this portal map that has seeded much of the Pokémon Go world—those portal locations have formed the basis for the Pokéstops and Pokégyms.

The portal maps were rooted, at first, on popular locations. This included not only obvious choices such as the Washington Monument, but also locations which were frequently geo-tagged in photos—in short, user generated data, where the original creator had no idea their geo-tagging would be used to site a real world game stop. In addition, Ingress players were invited to submit portal suggestions. Niantic was flooded with over 15 million suggestions, and the review and approval process was lengthy, opaque, and prone to inconsistency. One player might suggest a portal location and have it rejected, while another player would suggest the same place and get it approved months later. Over five million user suggested portals were placed.

Ingress, however, is a fundamentally and radically different game than Pokémon Go. For one, it didn’t have the power of a decades-long, beloved intellectual property behind it. It has a significantly smaller player base, even in when you compare the first bloom of launch, widespread press, and “try it out” adoption. While it supports social engagement and cooperation, the backstory of Ingress is one of intrigue and shadowy goings-on. It is aimed squarely at adults, and lacks the chance aspect of collecting items out in the real world away from portals that Pokémon Go has with its “gotta catch ‘em all” Pokémon gathering aspect.
And here’s where it all horribly collides. A quick search of geo-tagged photos reveals thousands of photos at places like the U.S. Holocaust Museum, Arlington National Cemetery, and the reflecting pools at the National September 11 Memorial & Museum. Sure enough, Arlington National Cemetery is littered with Ingress portals, including the Tomb of the Unknown Soldier, Medgar Evers’ tomb, the final resting place of Robert F. Kennedy, and more. And that’s translated to Pokéstops in what many consider sacred, hallowed ground.3 Similarly, the area around the National September 11 Memorial & Museum is rife with Pokéstops. But even if there weren’t stops at these places, Pokémon spawn all over the map, regardless of Pokéstops (though players can drop items at stops to lure Pokémon there). People could traipse through America’s iconic graveyard and memorial for service men and women snagging Magikarps and Psyducks. Or, as one New York author put it after visiting a variety of emotionally charged sites in the city, “That is a coffin of nameless orphans and that is a Pokéstop.”4

To put it mildly, it’s a problem with the game. Having the leadership of major memorials and venues come out and say they are trying to get their site delisted as a Pokéstop or gym does not make for great press. Homeowners who live in unusual or iconic buildings that are now private dwellings have found strangers in their yards and on their driveways at all hours of the day and night. And the process of delisting is fraught with challenges—within the game, one can “report an issue” with a stop or gym, but that is a general category of issue. At launch, there was no clear, obvious way for the director of a venue or the owner of a site to make an emergency or high priority request. Interestingly, many of the portals in Ingress at these challenging sites are relatively low level; that is, few people engage with them, perhaps out of a sense of propriety. The older, theoretically more mature audience of Ingress is likely more discerning about where and when it’s appropriate to play a game than an 11-year-old chasing a Pikachu, iPhone in hand.

All of this is not to say there aren’t positive aspects of Pokémon Go—far from it. Many libraries are reporting a surge in usage; colleges are cheerfully offering Pokémon tours, posting maps of Pokéstops and gyms on their campuses, and encouraging students to play together and responsibly. Players are self-reporting significant upswings in their physical activity levels (in order to incubate eggs that you can get at Pokéstops, you have to walk varying distances, in addition to the need to get out there and explore to find Pokémon, stops, and gyms). Kids and parents are frequently seen playing together in parks and playgrounds. Players are voluntarily leaving lures near children’s hospitals, so the kids inside who can’t walk the necessary blocks outside can still play the game. Within the Autism Spectrum parent community, there are already innumerable reports of children who typically avoid changes in routine and social engagement being willing to go to parks, engage with others, and try new things in the service of playing Pokémon Go. As a social experience, Pokémon Go is breaking barriers and getting people out and about—something many experience designers strive to achieve.

As designers of location-based entertainment and educational experiences, Thinkwell has long touted the promise — and challenges — of technologies such as AR, and the idea of using a mobile device to enhance and augment a visit to a theme park, museum, or attraction with gamification and social interaction. The experience since the launch of Pokémon Go highlights the need for owners and operators considering an AR overlay or component to take some serious precautionary and planning steps:

  • Think about your audience. As we’ve shown, part of the underlying issue with Pokémon is not just the different gameplay, but also the radically different and bigger audience. Creators need to think about who will be playing the game and how they engage with the world. One very smart thing that Niantic did relates to safety: if a Pokémon appears on your map, it can be caught from where you are (you can even switching from AR mode to on-screen play mode to make it easier). There’s no need to cross a busy street or hop a fence. Given that children and teens are playing, this was a savvy design choice.
  • Consider where engagements happen. Choose wisely, to be blunt about it — and if you are in essence outsourcing the location selection to data someone else has generated, have a review process and standards in place prior to launch and scrub your map accordingly. You cannot rely on user generated data to make responsible, thoughtful, mindful, or empathetic choices.
  • Have a clear process for handling people roped unwittingly into the game. It took over a week from launch for Niantic to unveil a way for ‘owners’ of questionable locations to quickly and permanently delist their locations; it’s unclear how the new system will prioritize delisting or how quickly requests will be addressed. Until Niantic quietly rolled out this system, the bad press and angry location owners continued to churn, and the damage is done.
  • Think through the ramifications of open world play. Pokémon can spawn almost anywhere, and this is a problem. A site such as a cemetery or memorial should be able to request that theirs is a ‘clear zone’ where no Pokémon spawn; currently they cannot. If you are developing a game that extends beyond the boundaries of your site, it behooves you to think about where gameplay is appropriate and inappropriate, and structure the game accordingly.
  • Work with location owners. While some location owners, such as small businesses benefitting from an uptick in traffic, welcome Pokémon Go players, others are still trying to figure out what to do about the fact that a fountain on their property is suddenly attracting people. Consider developing an informational kit that provides these location owners with contacts for reporting issues, ideas for how to capitalize on player presence, and an explanation of the game itself.
  • Be prepared to capitalize on unexpected positive outcomes. The positive effect of Pokémon Go on some children with ASD is an unforeseen, yet fantastic, effect of the game, that Niantic could build upon, perhaps by partnering with advocacy groups to develop targeted materials around the game. The active exercise aspect of Pokémon Go is another aspect that could be highlighted — imagine an ongoing tally of gross distance walked, or calories burned, by all current players? Groups developing new ARs should be willing to leverage unforeseen positive outcomes.

Much of the issue with Pokémon Go and AR in general boils down to the fact that it’s just new, uncharted territory. Or is it? It seems with any new technology and subsequent pop-culture craze that emerges from that technology, there is bound to be challenges, pitfalls, and hand-wringing. Before Pokémon Go, Sony Walkmans were distracting people into accidents — and now headphone-listening in public is something we’ve all adjusted to responsibly. Before Pokémon Go, videogames were “rotting our brains” and keeping kids indoors — and now it’s a burgeoning artform creating all new forms of social storytelling. There will always be folks in the herd whose bad behavior will ultimately get them thinned from said herd — but as designers, we can help craft experiences that will guide the audience in the right direction, with the right motivation — slowly creating audiences that are thoughtful, engaged, and maybe, hopefully, even more community-minded.


1 For an overview of AR, see http://www.explainthatstuff.com/how-augmented-reality-works.html
2 http://mashable.com/2016/07/10/john-hanke-pokemon-go/#iOfQr1i7vmq3
3 http://www.firstcoastnews.com/news/local/holocaust-museum-is-a-no-go-for-Pokémon-go/271981022
4 http://elitedaily.com/social-news/Pokémon-go-tragedy-sites-nyc/1549925/

White Paper | Intellectual Properties and the Branded Experience

Thinkwell’s 2015 Guest Experience Trend Report Focuses on Consumer Trends in Location-Based Entertainment Infused with Intellectual Properties

The recent surge in popularity of intellectual properties (IP) appearing in everything from theme parks and attractions to merchandise and museums had us at Thinkwell wondering whether this phenomenon will be an enduring profit generator for IP owners and the operators of entertainment and education venues. Does the presence of an IP lend credibility, trustworthiness, and value to a venue and would consumers be willing to visit this venue more often? Especially as more location-based entertainment (LBE) venues start to incorporate IPs, would visitors spend more money and time on their experiences and should IP owners start to license their properties more heavily to explore that possibility?

The 2015 Thinkwell Guest Experience Trend Report was created to answer questions like those. For the past two years, Thinkwell has published Guest Experience Trend Reports that investigated the behavior of guests as they explored theme parks and museums and how technology could be utilized to enhance or improve their visits. For the 2015 Guest Experience Trend Report, Thinkwell examined not only the behavior of guests as they navigated experiences, but also the reasoning behind deciding to go and make purchases at LBE venues.
Thinkwell had a nationwide survey conducted that polled over 1,000 adults with children to analyze their spending choices at family-friendly LBEs, specifically family entertainment centers, children’s museums, aquariums & zoos, and restaurants. The goal of the survey was to determine whether families would be inclined to visit one of those venues more often and spend more money on purchases if they were completely infused with a specific IP from a major motion picture, television show, video game, or book.

The results, while not entirely surprising, confirmed that families are indeed willing to spend more on an experience at an LBE if it featured a specific intellectual property. What was surprising however was that the results showed respondents would be less willing to spend an increased amount of money or time at an IP-specific educational experience versus an IP-specific entertainment experience.
Most respondents still preferred authentic and traditional experiences at children’s museums and didn’t necessarily feel that adding an IP would increase the value of the educational experience. Even at zoos and aquariums, which toe the line between education and entertainment, a smaller percentage of respondents stated they would pay more for things like annual memberships, merchandise, and souvenirs at an IP-specific location. But when going out for fun at family entertainment centers however, a much larger segment of respondents stated that they would be willing to spend more money and time on an IP-specific experience.

Entertainment Versus Educational Experiences
An astonishing 76% of the survey respondents stated that they would enjoy the experience at a family entertainment center more if it were infused with a recognizable IP from a motion picture, television show, video game, cartoon, or book. More than 62% of respondents also said they would be willing to spend more money on food, souvenirs, and merchandise if they included characters or imagery from a favorite IP. Not only did respondents claim that they would be willing to spend more money at a family entertainment center if it was IP-specific, 72% also stated they would visit more often than if it was a generic LBE venue.

Though an impressive 61% of respondents also stated they would visit a children’s museum more often if there were exhibits based around a child’s favorite IP, only half of respondents stated they would be willing to pay more for an annual membership, merchandise, or souvenirs despite having IP-specific elements at the museum. In a more traditional educational institution, respondents did not feel that having IP-specific exhibits added any value or incentive to visit the venue more often, nor were they inclined to spend more money on purchases there.

Even at a zoo or aquarium, which blends education and entertainment, only little more than half of respondents stated they would want to visit more often if there were IP-specific exhibits. Because respondents claimed that the primary reason they visit a zoo or aquarium is to spend time together as a family and not to see new or existing exhibits, having IP-specific overlays would not be a compelling enough reason for visitors to visit more often or purchase more merchandise or souvenirs.

While the previous three LBEs might be reserved for special occasions or weekend activities, 76% of respondents stated that eating out at a restaurant is a normal weekly activity. If an IP-themed restaurant was an option in addition to casual chain restaurants, fast food restaurants, and neighborhood restaurants, a majority of respondents stated that it would be a logical choice for their families when eating out. Particularly since a kid-friendly atmosphere was the most important factor for families in choosing a restaurant, having an IP-specific environment would please kids and parents alike, with Disney™, Star Wars™, and Harry Potter™ being popular IPs for influencing families on their themed restaurant choices.

The Why and Why Not
The study conclusively revealed that respondents would indeed be willing to visit an IP-specific LBE venue more often and spend more money on these experiences. But what were the motivating factors for these preferences? Based on 1,032 open-ended answers, the respondents who were more likely to prefer an IP-specific LBE stated that the experiences would be “more fun,” “make the kids happy,” and “make the experience more special.” These respondents felt that seeing recognizable or familiar characters and elements would be a treat for the kids and would be far more entertaining that visiting a generic LBE.
For the respondents that did not feel more inclined to visit an IP-specific LBE, cost was the biggest deciding factor against choosing these experiences over generic ones. These respondents did not feel that an IP-infused experience added any value for the implied increased cost, nor did they feel that the quality of the environment, food, merchandise, or souvenirs would be any better at an IP-specific LBE. Other consistent responses were that an IP would make the experience “too commercial,” “trendy,” and “distracting” so that families wouldn’t be able to fully enjoy their time at an IP-specific LBE.

The Value of Intellectual Properties
After examining the survey responses, the 2015 Thinkwell Guest Experience Trend Report concludes that IP owners can absolutely benefit from licensing and infusing their IPs into family entertainment centers, children’s museums, zoos & aquariums, and restaurants. Respondents were generally positive about wanting to experience IP-specific LBEs and were willing to pay more money and spend more time at these venues. So to answer our initial question about whether extending an IP could be an enduring profit generator, the study confirms that there is a demand for it and IP owners should invest in meeting that demand.
“Thinkwell has believed in the power of an intellectual property in attracting and retaining guests since the very beginning of the company,” said Craig Hanna, Thinkwell’s Chief Creative Officer. “This study highlights that the value of blockbuster brands and IP is only getting stronger, even in an increasingly crowded market, and that the public’s thirst for IP hasn’t been quenched yet.

Museums & the Digital Revolution: Consumer Trends in Mobile and Interactive Technology Integration in Museums

As museums and the visitors they attract are evolving, is this a space looking for increased digital and mobile interactivity?
Last year, Thinkwell released the company’s first Guest Experience Trend Report revealing the growing trends among Theme Park guests and their use of technology when they visit Theme Parks. Surprisingly, the results revealed that younger guests were much less concerned with mobile integration and that families and older guests primarily have an appetite for consumer-oriented mobile integration in theme parks.
This report inevitably led Thinkwell to think about this topic in relation to the company’s other specialized fields. We asked ourselves if we thought these results would carry across the various market segments in which we practice. With such high focus on technology and mobility in our lives today, are guests looking to integrate technology into their visitor experiences? Museums and the visitors they attract are evolving, so Thinkwell asked, is this a space looking for increased digital and mobile interactivity? The 2014 Trend Report honed in specifically on the current museum guest experience and visitors’ expectations and desires for such digital and mobile integration.
Thinkwell began a nationwide survey analyzing behavioral patterns in relation to guest experiences in museums. The survey reached over 1,400 museumgoers and found that 69 percent of the respondents bring mobile devices (tablets and/or smartphones) with them while visiting a museum. Of that 69 percent, a total of 73 percent used their device during their visit, most notably to take photos. Similar results were found in last year’s report on theme park mobile integration.
Though museums are using indoor GPS systems in conjunction with apps to push location-appropriate content to visitors, tailored to the exhibit they are in, Thinkwell is only seeing about 32 percent interest in such a feature. This result explains why over half of museum app users have uninstalled or not installed an app due to concerns about personal information, and 19 percent turn off the location tracking feature on their cell phones. Results show that this consumer market is not extremely eager for location-aware app advancements to enhance their in-museum experiences.
WHAT MUSEUM GUESTS LIKE
When asked to rank what they find to be the most beneficial features of museums, respondents chose as their top three: educational for me and/or my family, the ability to see real art and artifacts, and the content of the exhibits. Guests are visiting a variety of museums, from art to history to zoos and aquariums to get the personal satisfaction of bettering themselves and their families through education and learning.
The desire to see real art and artifacts contradicts a report from last year that suggested guests would be satisfied with highly accurate reproductions, as younger generations gravitate towards content and experiences, rather than originals. Our findings show that across all age demographics, guests highly value access to the authentic artifacts and art pieces available at museums, citing it as the second most important aspect of museums.
In regard to features that could improve a visitor’s experience, 42 percent would like to see more interactivity incorporated, and 40 percent of respondents feel that the use of audio related to a topic or object would be beneficial. Interestingly, a small minority of respondents would like to see an increase of adult-only extended hours and events. The interactivity guests seek is not limited to those found in digital devices. Visitors are interested in social and personal interactions that break beyond the four walls of the museums, with activities such as: after-hours events, classes and presentations from artists and subject-matter experts for children and adults, and kids crafts. They are more interested in increased human interactivity than in digital integration such as mobile apps or 3D printed, touchable objects.
On average, visitors spend a total of three hours at museums per visit. Not only do respondents ages 18-44 spend more time per visit than those ages 45 and up, they are also more likely to visit museums more often. Forty-four percent of respondents ages 18-44 visited museums 5 times or more during the past two years, while only 32 percent of those ages 45 and up did so.
white-paper-graphic-elements-02
WHAT MUSEUM GUESTS DO NOT LIKE
While Thinkwell had many findings in the annual Guest Experience Trend Report pointing to the positive qualities of museums, we also found that over 57 percent of visitors are highly concerned with cost of entry for museums today.
Other negative factors affecting museum visits included overcrowding and outdated content. Respondents felt strongly about having newer exhibits and special events as encouraging factors of repeat visits. Overwhelmingly however, 88 percent of respondents ranked their last museum visit as quite enjoyable or better.
Some believe that digital integration in the museum space is necessary to expand the experience both virtually and in terms of new types of physical space to engage those accustomed to interacting with a screen. However, Thinkwell’s findings reveal that the museum space is one used to escape screens and the digital world. Guests are focusing more and more on the authenticity of the art and artifacts.
white-paper-graphic-elements-03
MOVING FORWARD
In an increasingly interconnected and digital world that gives easy access to infinite amounts of data and information, the value and role of museums has come into question. While it’s clear that museums need to adapt to shifts in technology, guests still look to them for authority and authenticity. Digital technologies can be helpful to museums in order to supplement their content, but visitors still crave social interactions, personal enrichment and access to original, authentic objects. Custom experiences can be tailored to the individual, but guests still want those experiences to take place in a physical space with real live experts there to teach them and answer questions.
“We believe the best way to engage visitors in an experience is to have them participate in stories they can relate to and that are authentic and compelling,” said Craig Hanna, Chief Creative Officer of Thinkwell Group. “Museums are competing not only for time but also attention. Consumers can get content from their mobile devices. Museums need to do what they do best—present authentic content in a meaningful way that connects with their core constituencies—while also incorporating digital technologies to keep those experiences fresh and up to date with consumer expectations.”
“The results of the survey are fascinating and, for museums, heartening. Real stuff, real stories, real human experiences: it’s what museums do best, and it’s what visitors crave,” said Cynthia Sharpe, Senior Director of Cultural Attractions and Research for Thinkwell Group. “In conjunction with the fantastic research done by Jay Greene’s group at the University of Arkansas at the Crystal Bridges Museum of American Art regarding the value of field trips and the importance of facilitation, it bolsters the approach of using personal digital technology as a tool in the storytelling and educational arsenal. The educational and emotional impact of seeing real artifacts and experiencing great interpretation is paramount.”
Survey Respondent Demographics
white-paper-graphic-elements-04
Qualifying participants were United States residents over the age of 18 who had visited a museum/exhibit in the past 24 months. Of the 1,407 respondents, 42 percent were male and 58 percent were female. Nineteen percent were between the ages of 18-29; 26 percent between the ages of 30-44; 28 percent between the ages of 45-60; and 27 percent are 60 and above. Household incomes ranged between $25,000 and over $150,000. Less than 1 percent held less that a high school degree, 6 percent held only a high school degree, 29 percent had some college or an Associate degree, 40 percent had a Bachelor’s degree, and 27 percent had a Graduate degree. The survey found very little correlation, if any, between gender or location and current mobile behavior or interest in increased mobile integration for museums experiences.
Thinkwell is available for speaking engagements. Please contact us for more information.
View the White Paper accompanying this infographic here.

Infographic | Museums & the Digital Revolution: Consumer Trends in Mobile and Interactive Technology Integration in Museums

Thinkwell’s findings of their nationwide survey analyzing behavioral patterns as they relate to existing and potential mobile integration into the museums and exhibit experience is illustrated in the infographic below. This survey marks the second release of Thinkwell’s Guest Experience Trend Report, which provides market research insights to the themed entertainment industry. The annual report measures and distills consumer interests in varying topics related to guest experiences.
Thinkwell's 2014 Guest Experience Trend Report - Infographic
Read the White Paper accompanying this infographic here.